Encourage Interactive Engagement with Dynamic Visuals
Whether your preference is classic Looney Toons, the revolutionary work of Pixar, or the mind-bending offerings of “Rick and Morty,” it’s easy to argue that a little animation can make just about anything better.
Avoid the 'Death by PowerPoint'
The same holds true for business presentations and corporate training. Rather than subjecting your team members and trainees to the dreaded (and sometimes funny) “death by PowerPoint,” consider putting some of the elements of your program into motion to not just help keep your audience focused, but also offer them the opportunity to engage interactively.
Using a combination of real-time polling software and audience response technology, more and more companies are incorporating animation into presentations in ways that reflect creativity and provide immediate feedback to the audience.


Boredom Cure - Real-Time Results Animation
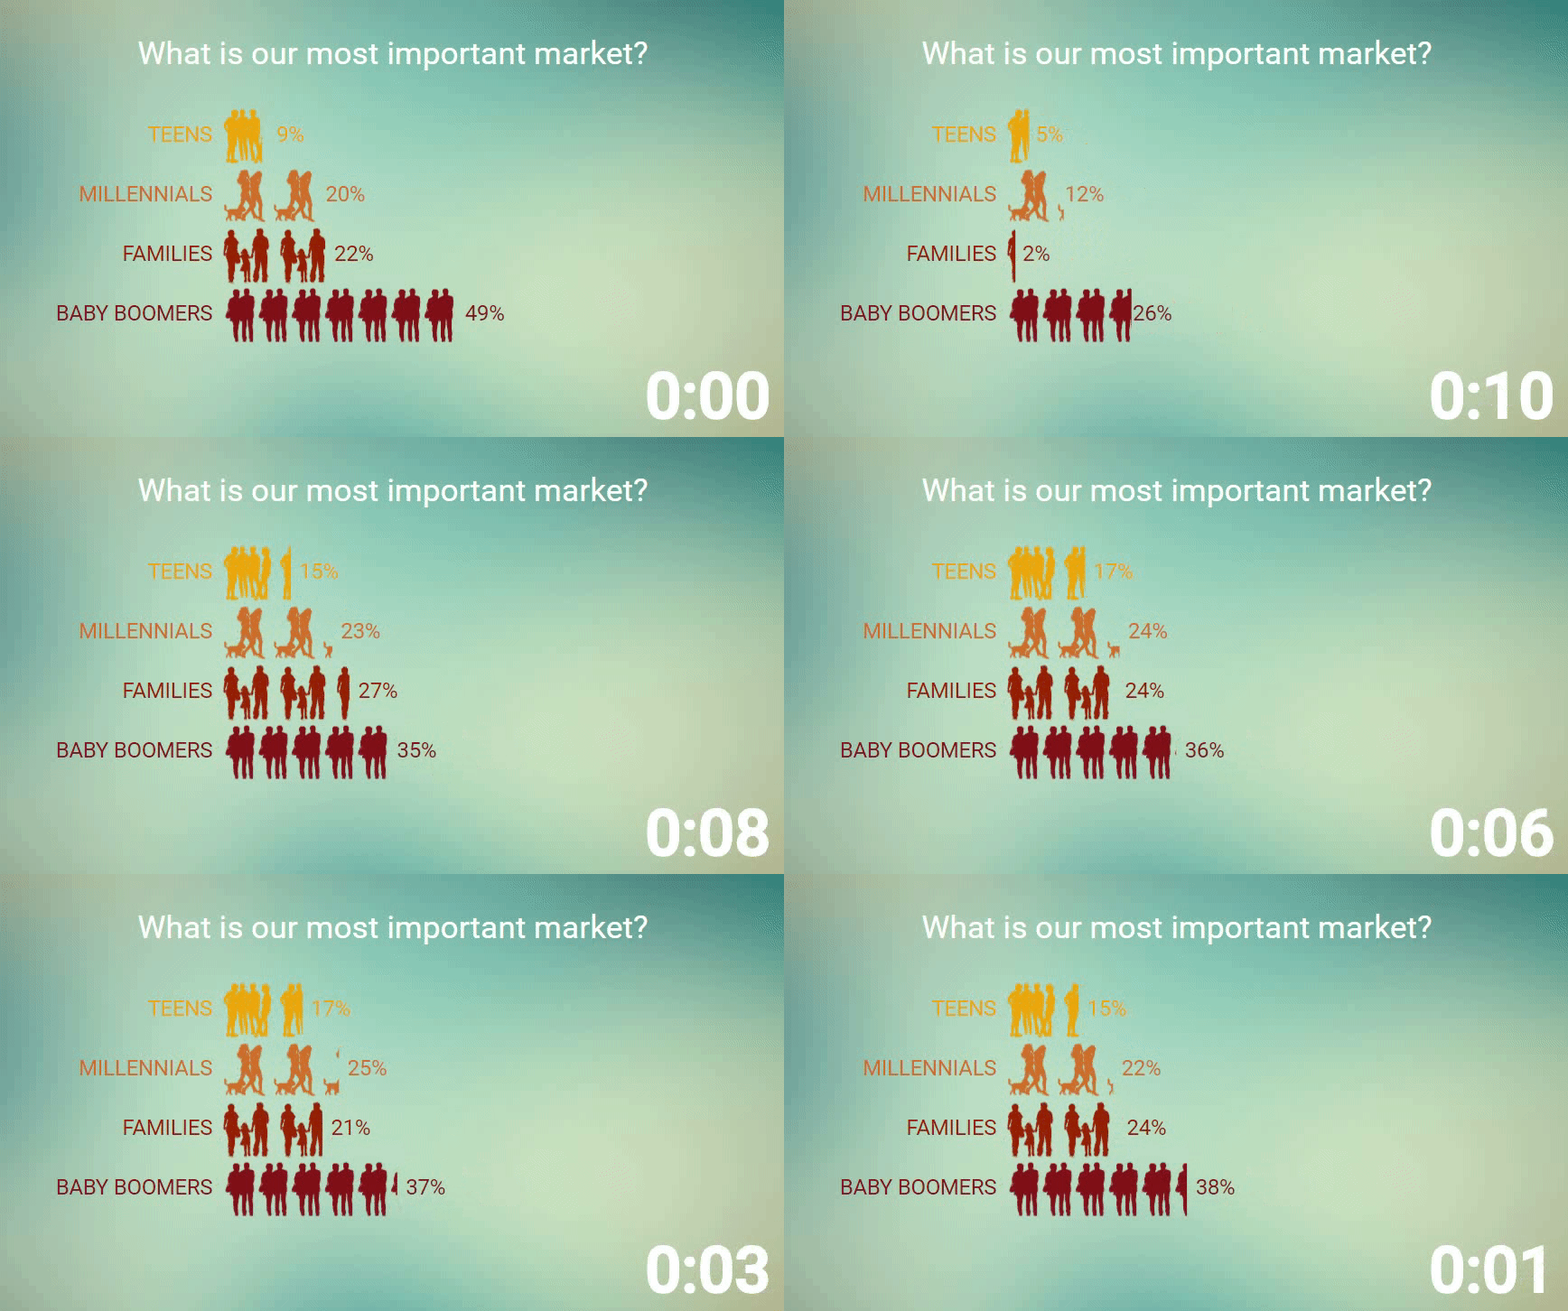
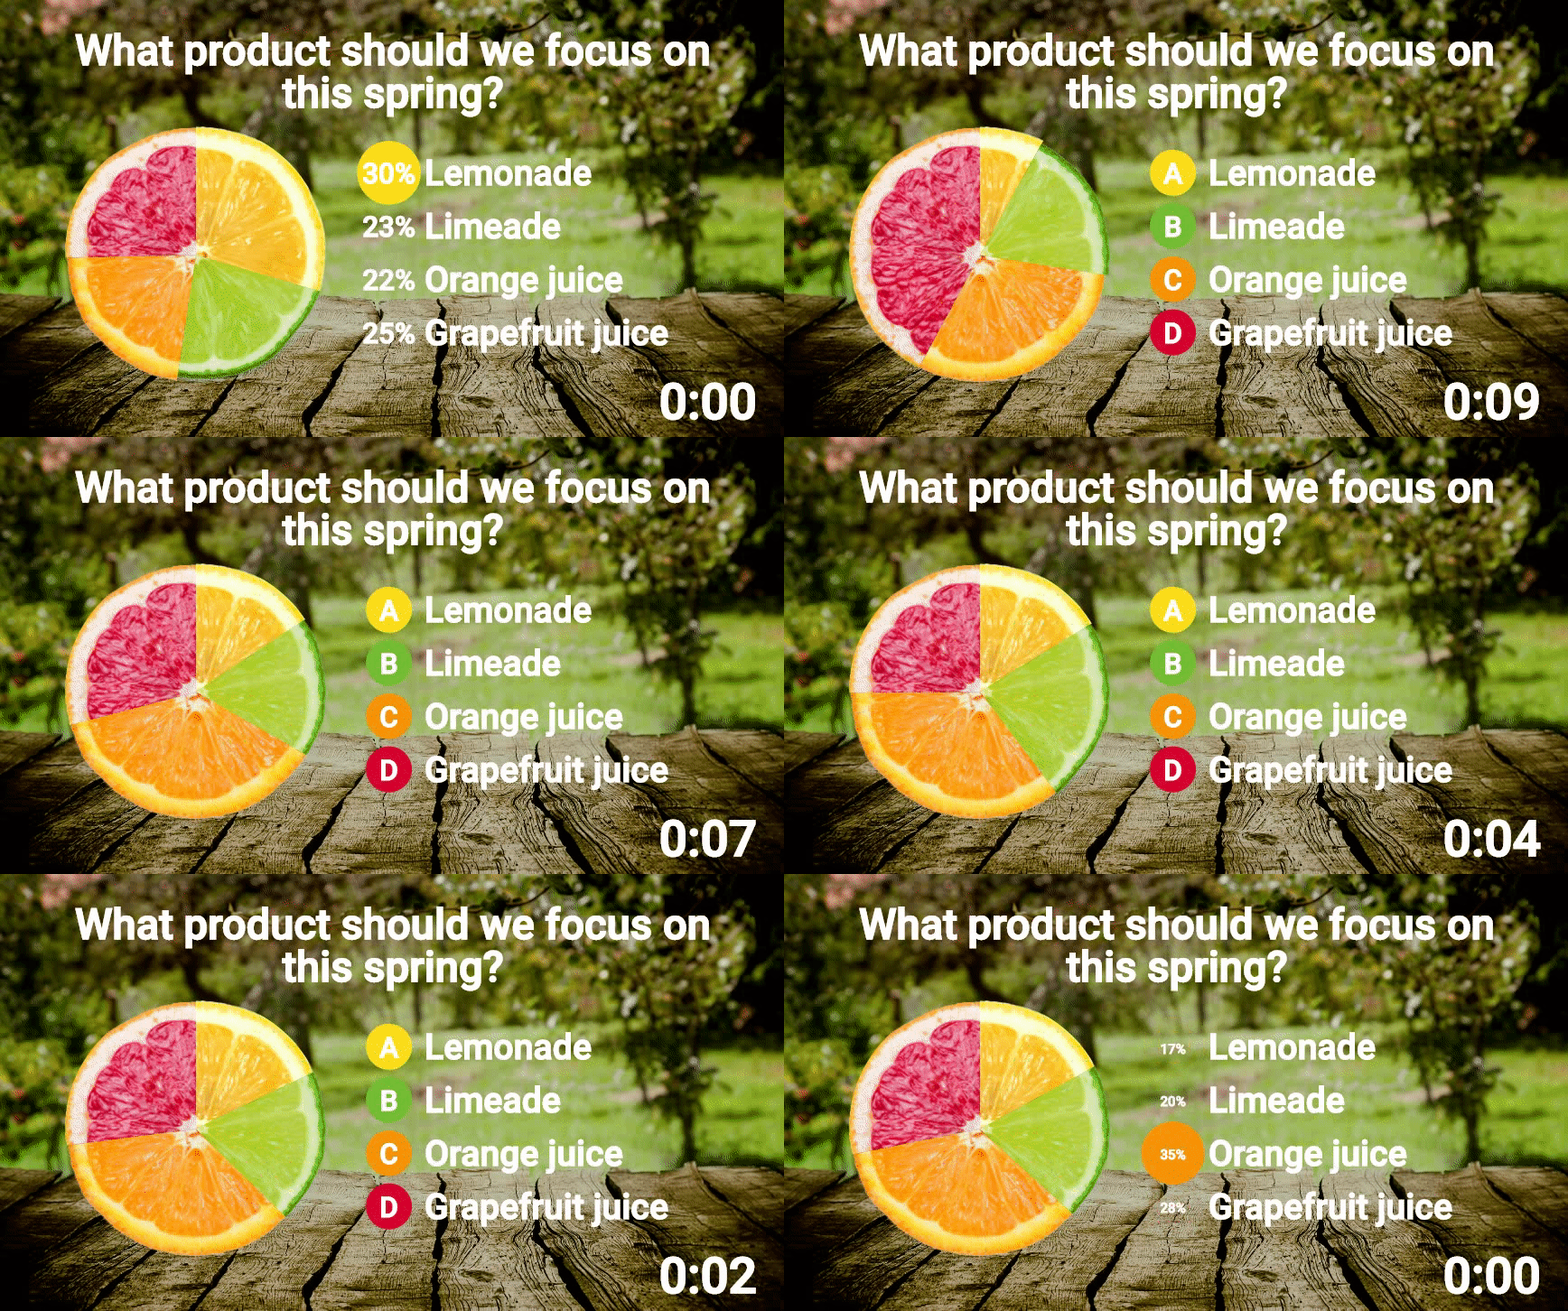
Using this format, the presenter can offer a question to the audience or trainees with what would appear to be a static graphic projection. Once the answer period is opened, though, participants using audience response keypads or their smartphones enter a response.
Using real-time polling software, the survey response is immediately displayed within the graphic using animated bar graph, pie graph or “filling” effects – in which a container’s contents appear to increase or decrease based on how the participants respond.
Corporate Branding Opportunity
Incorporating these types of dynamic visuals not only boosts the overall engagement in the program, but can also serve to reinforce corporate branding. For example, one popular international producer of beer and spirits used the “animated filling” feature in several slides of a corporate meeting, in which a glass of one of the company’s hard ciders was gradually filled base on audience responses to questions about the future of brand sales. In another slide, brands of beer were used as graphics in a bar graph representing the participants’ response to a question about soccer potentially improving beer sales.
With the right graphics, well-worded questions and a little imagination, it’s possible for just about any presentation to be improved with dynamic visuals – no cartoon rabbits required.


